Introduction
Dumpsters are a ubiquitous feature in populated areas that often go unnoticed and may fall in a state of disrepair. A dumpster that leaks and does not properly contain trash can be a major source of pollution to the environment. As part of the final project for GEO 4430: Field Methods, I created a map to demonstrate that the dumpsters in San Marcos, TX could be a major contributor of pollution to the San Marcos river.
I photographed and recorded observations on the conditions of 50 dumpsters, and six trash compactors in a 0.63 mile2 study area. Using GIS, I found that all the dumpsters in this study area were located uphill of the San Marcos river. It seemed reasonable to assume that pollution originating from these compromised dumpsters would likely end up in the river.
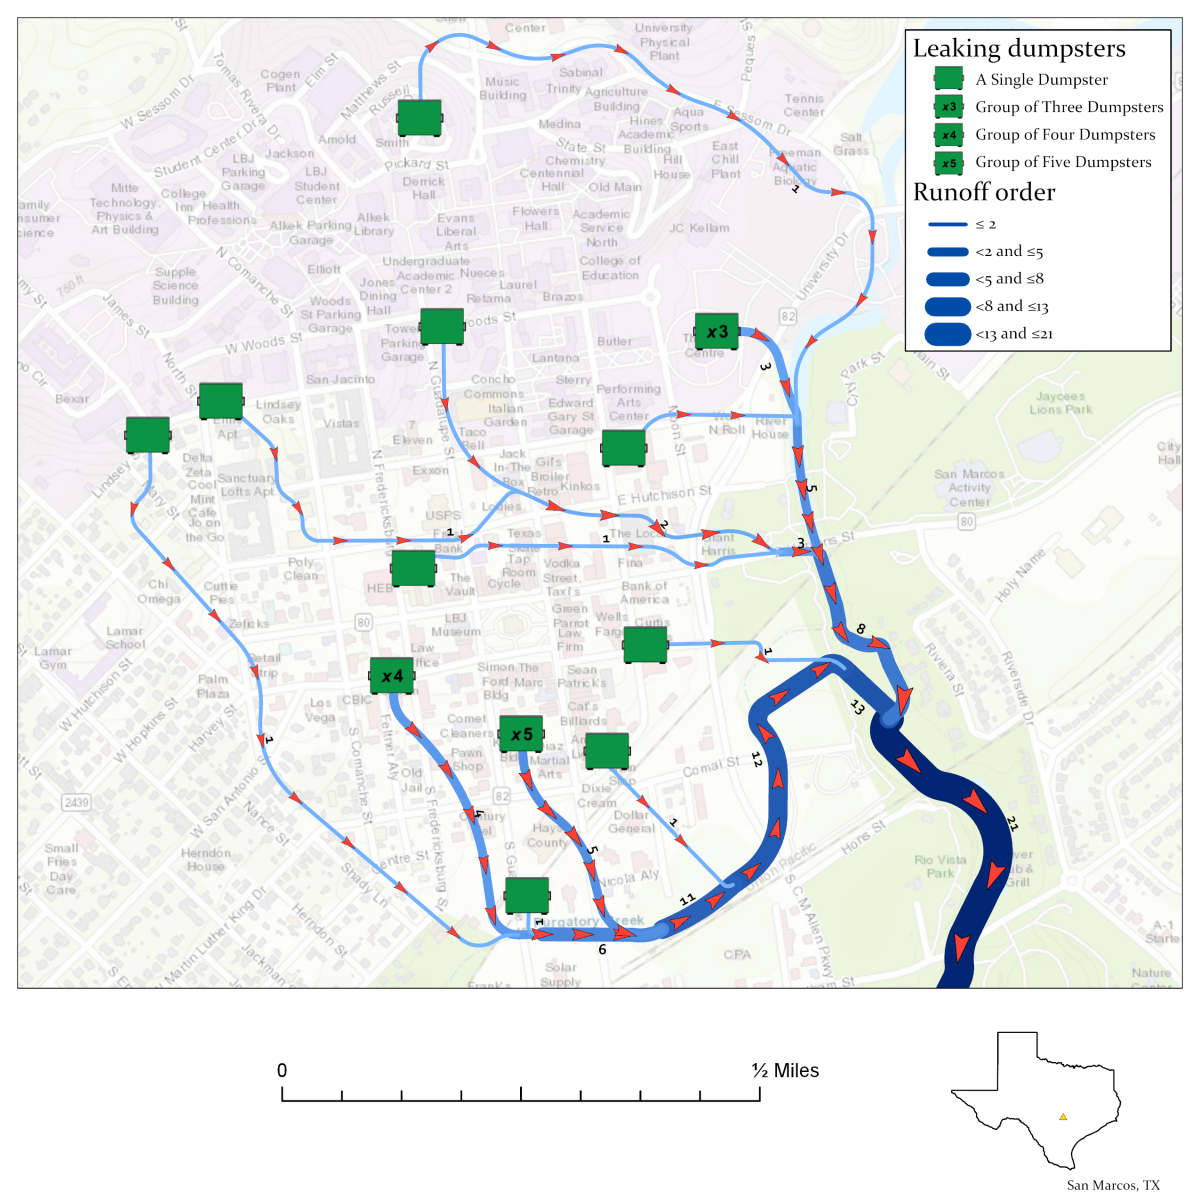
Estimated Paths of Runoff Originating from Leaking Dumpsters
This is the final product of the Dumpster Project. It was created with a custom Python program that traces the downhill flow of runoff from multiple points of origin. The final flow lines were turned to vectors by hand in ArcGIS Pro. The graduated symbol and color used for the flow lines are intended to illustrate the cumulative effects that individual sources of pollution can have on the environment.
Data Collection
The study area for the project included the main Texas State campus and parts of the commercial area to the south of campus. The total area of the study area is 0.63 mile2 (1.63 km2). This area was chosen for the convenience, containing several types of land use, and having high concentration of dumpsters. The study area was exhaustively searched for all possible dumpster that could be accessed. The following information was collected for each dumpster:
- Date and time
- Waste management company
- Identification number
- Status of dumpster lids
- Status of drain hole
- Presence of a padlock
- Signs of runoff
- Customer/location
- Other observations
A total of 335 photos were taken with a smartphone to help visually document the condition of the dumpsters in the study area. These are examples of the photos that were taken:
GIS Work
Data Management
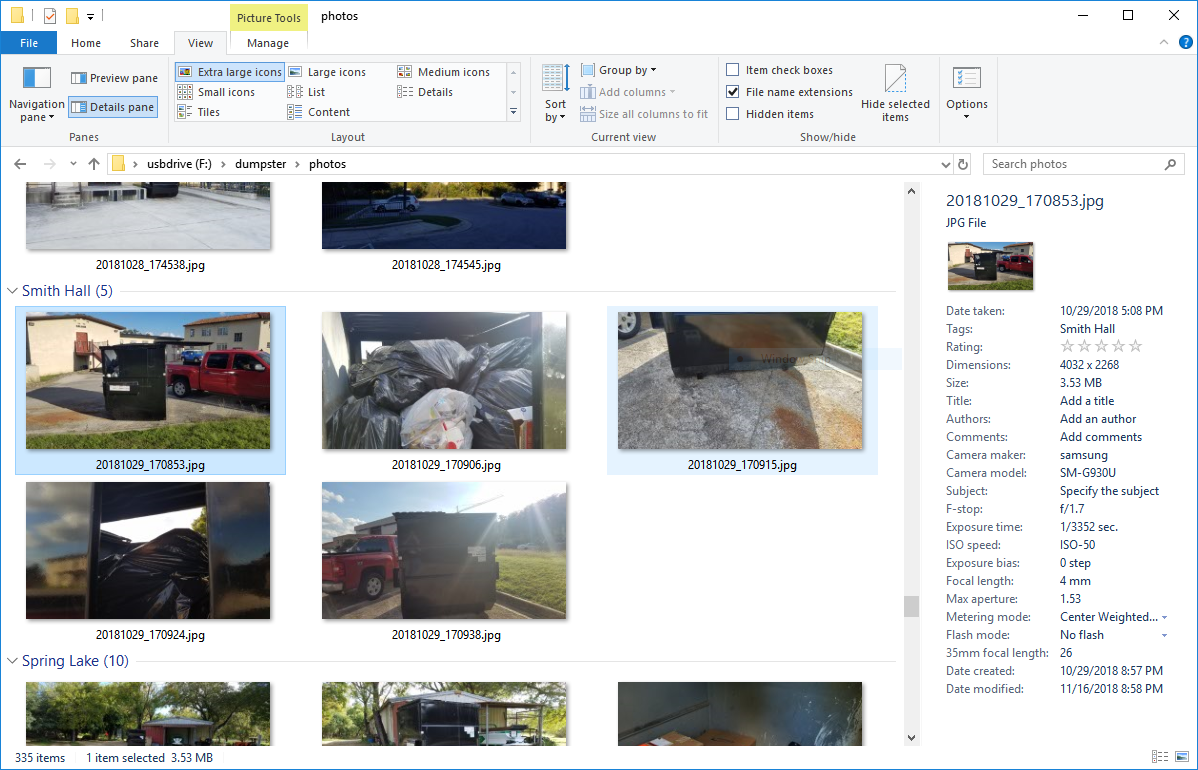
Observations about each dumpster were recorded in a spreadsheet. Photographs taken during the project were placed together in a folder. Each photograph was grouped with the appropriate dumpster by assigning the photos a tag that is unique to that dumpster. The time of observation, photo time stamp and visual clues in the photographs assisted in identifying the corresponding dumpster. The photo tags were added to the spreadsheet for use as a key to later join the photographs to the data from the spreadsheet.

This is a screenshot of five photographs that have been grouped by the tag “Smith Hall.” This helps keep the photographs associated with the dumpster located between Smith and Burleson Hall.
Analysis
The “GeoTagged Photos to Points” tool in ArcMap was used to create a point feature class containing the locations where every photograph was taken. Only the point that best represented the true location of each dumpster was retained. A few points required manual modification to make them better reflect the actual location of a dumpster. The spreadsheet data was imported into ArcMap as a table. This data was used as attributes for each point by joining the point feature class with the data table using the photo tags as a common field. The joined data was then saved as a new point feature that would later be used to represent the location of the dumpsters when performing raster analysis.
Finally, a short Python script was written to calculate, using a D8 flow raster, the most direct downhill path of runoff using each dumpster point as a starting spot. The coalescence of the various flows formed a network of runoff that resembled a stream network. The paths of runoff were traced by hand in ArcGIS Pro to create the final linework.
